Previous
Storage Index: August 2026 is out!

 October 12, 2026
 By Rachel Locquet, Lead Consultant and Head of Price Forecast, Clean Horizon
Batteries that charge in surplus hours lift the lowest prices and let more renewable output into the grid. A battery earns on the gap between low and high prices, though, and its own dispatch narrows that gap. How far storage goes depends on its economics and on grid access.
This article is based on Rachel’s presentation at Solarplaza Summit Nordics: Renewables & Storage in Copenhagen on September 15, 2026. Her slides are available at the end.
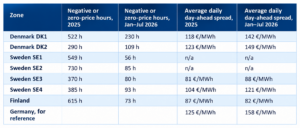
Negative-price hours are counted from ENTSO-E day-ahead prices and include hours at exactly zero. The 2026 columns stop at the end of July, so they compare seven months with a full year. The daily spread is the average of the four highest quarter-hour prices of the day minus the average of the four lowest, on ENTSO-E prices at 15-minute resolution.
Storage capacity comes from Clean Horizon’s tracking of publicly announced projects. Revenue figures come from the Clean Horizon Storage Index for a 4-hour battery, annualised, with 2026 running to July. Forward-looking statements come from the Clean Horizon Price Forecast S1 2026. Two charts in the presentation are illustrative or have no value axis. They are described in words here, without figures.
Renewables, nuclear and hydro bid at or near zero and run whatever the price. The demand they leave uncovered is the residual load. It climbs the paying part of the merit order, through CHP and biomass, then coal and gas, then peakers and imports. The marginal unit it reaches sets the price for every megawatt-hour in that period.
The curve is convex. It stays flat while hydro is at the margin and turns steep once thermal plants and imports take over. The level of residual load therefore decides which part of the curve sets the price, and how far apart the cheap and expensive hours of a day end up. In Finland, Clean Horizon found that residual load explains part of the variation in day-ahead spreads, with an R² of 0.40. The relationship is real but explains only part of the picture.
When renewables, hydro and nuclear produce more than the system needs, the system is long. Those surplus hours are the ones that produce curtailment and negative prices.
In 2025, SE2 recorded 730 hours at or below zero, Finland 615 hours and SE1 549 hours. In those three zones, high wind and low demand contribute to negative-price events and to the risk of curtailment. Many of their negative hours fall at night as well as around midday. In DK1, negative hours concentrate around midday.
Solar. Between the midday solar trough and the evening peak, net demand slides along the merit order curve, and the wider that swing, the wider the spread. High-solar days tend to be high-volatility days. High-wind days tend to be low-volatility days.
The first seven months point that way, most clearly in the north. By the end of July 2026, SE1 had 56 negative or zero-price hours, SE2 had 85 and Finland 73, against more than 500 hours in each of those zones in 2025. DK1 stood at 230 hours.
Rachel Locquet points to three factors. Demand has become more flexible and absorbs more of the surplus hours. Prices have risen overall, pushed up by higher gas prices. More batteries are also in operation, adding demand when prices are lowest.
Seven months against twelve is still not a like-for-like comparison, and the 2026 totals can only rise by December.
Fewer negative prices would suggest flatter days and narrower spreads. The data shows the opposite. The average daily spread rose in four of the five zones measured. It reached 149 €/MWh in DK2, 142 €/MWh in DK1, 121 €/MWh in SE4 and 88 €/MWh in SE3. Finland is the exception, slipping from 87 €/MWh to 82 €/MWh.
Clean Horizon attributes the higher volatility to rising gas prices, the move to 15-minute day-ahead timeslots and higher renewable penetration. Gas plants sit on the steep part of the merit order, where the peak hours are priced.
The German spread rose from 125 €/MWh in 2025 to 158 €/MWh in 2026. DK1, DK2 and SE4 are well interconnected with Germany and benefit from that link in terms of volatility. They are also the three Nordic zones with the highest spreads.
For a battery, the bottom and the top of the day move for different reasons. Negative hours depend on local wind, solar and demand. The peak depends partly on gas and on prices across the border.
Ancillary service markets have a fixed size, set by system needs. As the Nordic fleet grew, they saturated, and battery revenues shifted towards energy trading.
The fleet has grown quickly. Between September 2025 and September 2026, the storage pipeline, counting operational, under-construction and announced projects, grew by 402% in Finland, 67% in Sweden and 49% in Denmark. Finland’s operational capacity went from 295 MW to 1,614 MW. In Sweden, Clean Horizon estimates operational capacity at 1.5 GW from the power prequalified on ancillary services, while 809 MW is publicly reported as operational.
Our 4-hour Storage Index shows the shift in revenues. In DK1, ancillary services brought in 322 k€/MW of the 436 k€/MW earned in 2025. Up to July 2026, they brought in 155 k€/MW of 461 k€/MW annualised, with intraday contributing 242 k€/MW. In Finland, the index fell to 152 k€/MW annualised in 2026. Day-ahead trading there brought in more than ancillary services, at 76 k€/MW against 60 k€/MW.
A trading battery charges when prices are low, which means when the system is long. Its charging adds demand in exactly the hours that produce curtailment and negative prices.
A battery charging in surplus hours changes the shape of the residual load. The bottom of the day is less deep, prices in those hours rise, and renewable output that would have been curtailed finds a buyer. In the words of the presentation, storage is already reshaping the mix.
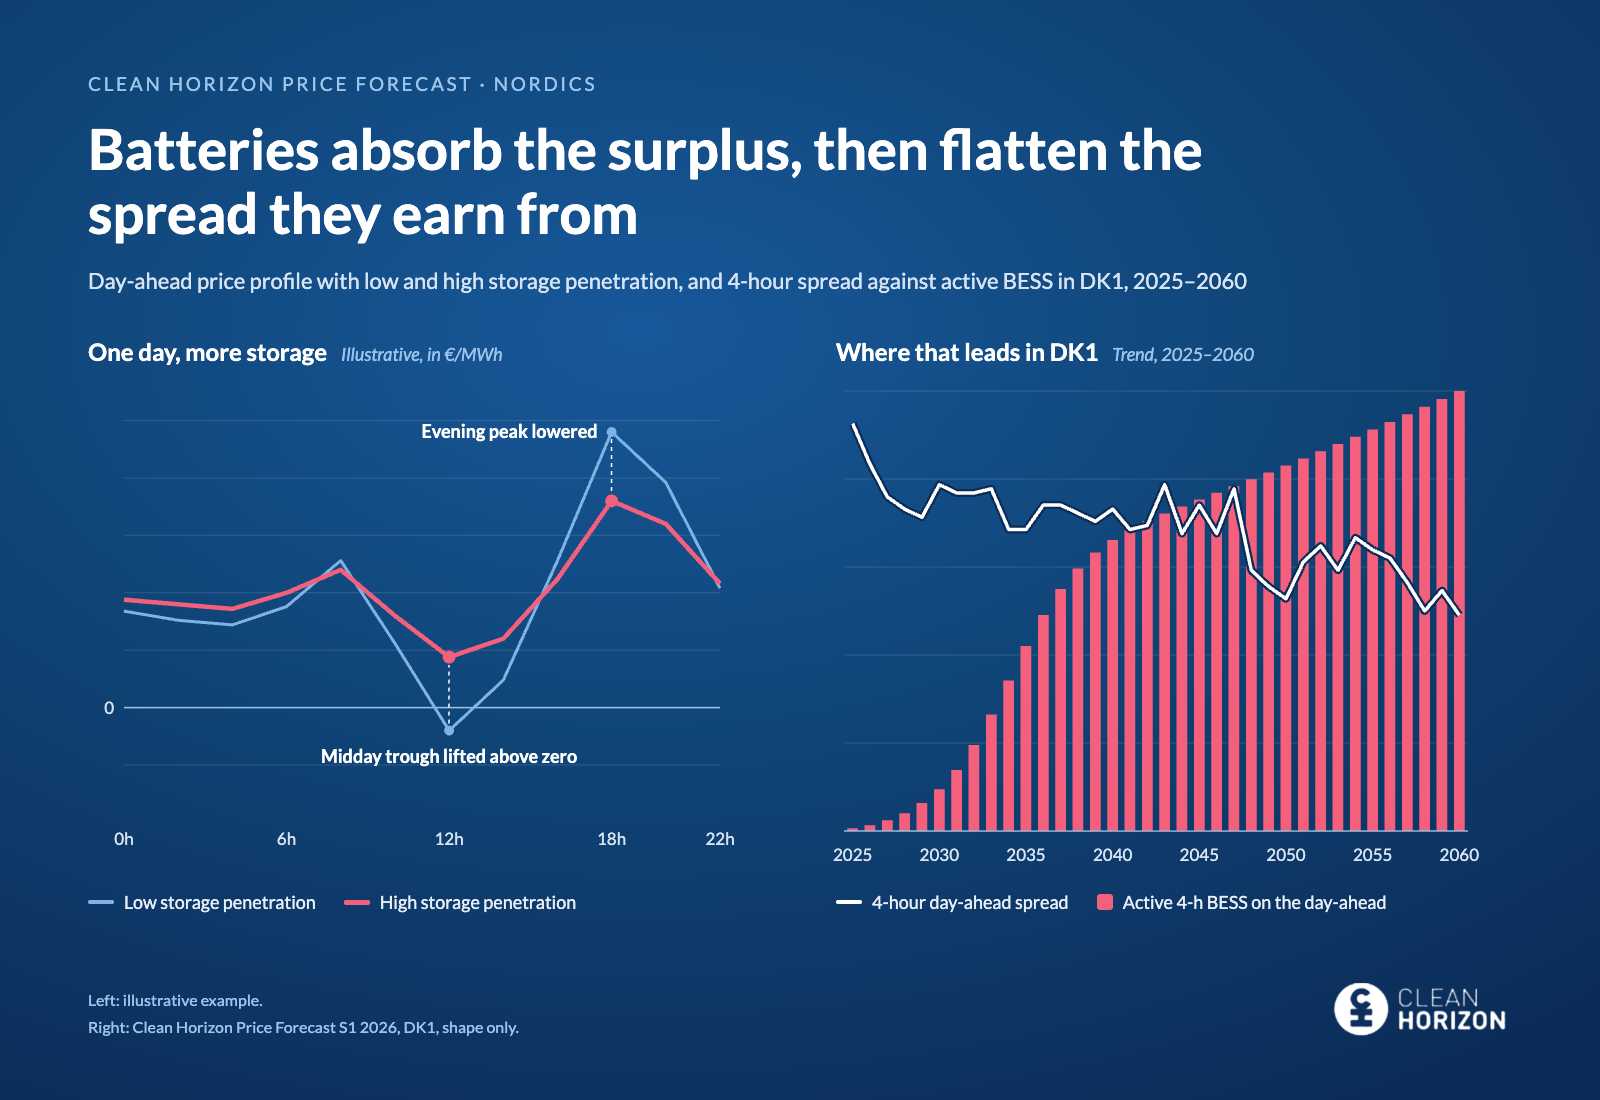
The same battery discharges when residual load is high, adding supply in the evening and pulling the peak down. Clean Horizon’s illustrative day-ahead curve shows both effects. With high storage penetration, the midday price no longer goes negative and the evening peak is lower. Negative prices become rarer, and so do peak prices.
This is where the effect starts to limit itself. A battery is paid on the difference between the two ends of the day, and a growing fleet narrows that difference. Storage competes with itself.
Over time, they tend to. Clean Horizon modelled the DK1 day-ahead 4-hour spread (TB4) against the capacity of 4-hour batteries active on the day-ahead market, out to 2060. As that capacity grows, the spread trends down, unevenly, with some years rebounding.
Day-ahead volatility also drives most of a battery’s other revenue opportunities, including intraday and balancing. A flatter day-ahead curve affects the whole revenue stack, not just one market.
A battery earns on the difference between prices, not on cheap power alone. Its profitability depends on the future mix: how fast demand grows, how much renewable capacity is added and how much storage is built alongside it. If trading opportunities shrink, returns fall and deployment slows. The effect on negative prices then slows with it.
Our DK1 forecast for a 100 MW / 400 MWh battery shows the sequence. Revenues are expected to decrease in the short term as more batteries enter ancillary services. Later, storage starts to weigh on day-ahead volatility and intraday opportunities. Because the remaining revenues are purely energy-based, longer-duration systems benefit from higher profitability. Wholesale markets are forecast to make up to 80% of the stack by 2028.
Data centres, electrolysis and electrified industry can also absorb surplus energy. Finland alone received about 68 GW of consumption connection requests in a single year, according to Fingrid’s half-year report for January to June 2026.
How fast any of this happens depends on grid capacity and on the years it takes to connect. For batteries and flexible demand alike, that is the binding constraint.
A developer weighing a battery against a curtailed portfolio, or an investor reviewing a Nordic storage case, can start with five questions.
A bankable long-term revenue stack rests on four families of assumptions. The first is the electricity mix: renewables development, demand growth and thermal capacity. The second is commodity prices for carbon, gas and coal, which set the marginal cost of thermal power plants. The third is neighbouring countries, through their own mix and changes in interconnection capacity. The fourth is flexibility: storage deployment, demand-side response and hydro.
Bottom line: batteries will reduce curtailment and negative prices in the Nordics, but only as far as their own business case allows. In a Nordic battery valuation, the spread curve depends on how much storage gets built alongside the asset, and the two have to be modelled together.
The monthly Nordic revenue indices are free on the Storage Index page. For Germany, where the same questions arise, see Negative prices on day-ahead markets: why and what’s next?.
Would you like to discuss Nordic storage revenues, price forecasts or project opportunities? Let’s talk