Previous
Storage Index: September 2026 is out!

 November 4, 2026
By Salomé Perperot, Consultant, Clean Horizon.
Battery revenues in Europe are moving from ancillary services to trading on the day-ahead and intraday markets, and the speed depends on how quickly each market fills with batteries. Once the ancillary markets are cannibalised, energy markets carry most of the revenue, so the trends to expect there become the real question. Over the first eight months of 2026, a 2-hour battery earned between about 100 and 600 k€/MW/year depending on the country.
This article follows the presentation given at Maxxen Day 2026 by Salomé Perperot, Consultant, Clean Horizon, the European Battery Storage Forum, in Aydın, Türkiye, on 1 October 2026. The full slides are linked at the end.
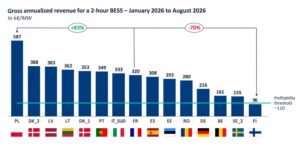
Gross annualised revenue of a 2-hour battery storage system in 15 European markets, January to August 2026
The table ranks the 15 markets of the Storage Index by the gross revenue a 2-hour battery earned over the period, before grid fees and operating costs.
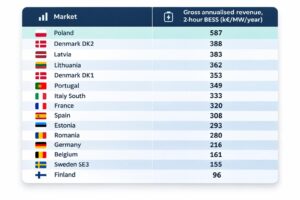
Source: Clean Horizon Storage Index, average of the monthly values from January to August 2026.
The Storage Index gives the annualised revenue of a battery from the energy, capacity and ancillary prices of each month. COSMOS, Clean Horizon’s simulation tool, runs the battery on every market open to it. It assumes imperfect foresight on day-ahead, intraday and ancillary markets, 85% round-trip efficiency, 1.5 cycles a day, a state of health and an availability of 100%, and the prequalification rules of each ancillary market. Revenue is gross, before grid fees and operating costs.
Only Finland falls below the indicative profitability threshold of about 110 k€/MW/year, explained further down. Against France, near the middle at 320 k€/MW, Poland is 83% higher and Finland 70% lower.
Reserves account for 456 k€/MW of Poland’s 587 k€/MW, close to four-fifths, and aFRR capacity alone is close to half of the total. The reason is scarcity: around 300 MW of batteries operate in Poland, against an ancillary service volume requirement of 1,791 MW (the sum of the reserved volumes of FCR, aFRR and mFRR), so each battery is paid well.
Finland went through the same stage, but the share of revenue coming from reserves has now decreased significantly. Between March and September 2025, its monthly 2-hour index stood between 267 and 484 k€/MW. Since November 2025 it has not gone above 149 k€/MW, and August 2026 came in at 78 k€/MW. Over the eight months it averaged 96 k€/MW: around 45 from day-ahead, 40 from ancillary services and 10 from intraday.
The presentation puts the tipping point at the moment storage becomes the marginal asset delivering ancillary services, meaning installed batteries exceed what the system buys.
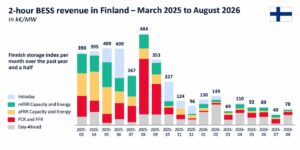
Monthly revenue of a 2-hour battery in Finland by market, March 2025 to August 2026
The table sets Poland’s battery pipeline next to Finland’s, each against its own ancillary service requirement
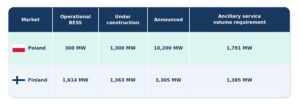
Source: Clean Horizon. Pipeline figures count publicly announced and under-construction projects.
Finland is past the tipping point, with more operational batteries than the requirement. Poland is not there yet, but with over 10 GW of BESS projects announced or under construction, ancillary service revenues are likely to follow the Finnish pattern and decline rapidly once a significant share of this pipeline is commissioned. Two other cases are covered in: Can battery storage remain profitable after ancillary service market saturation? and Belgium’s aFRR market: saturation shifts the game.
In Clean Horizon’s central scenario, the revenue of a Polish 2-hour battery decreases significantly after 2026 as ancillary services saturate, but it can still be profitable. Day-ahead and intraday markets become the largest share of revenue.
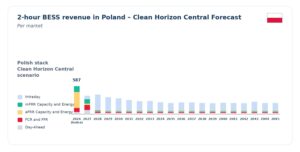
Forecast revenue stack of a 2-hour battery in Poland from 2026 to 2045.
The chart shows the shape of the scenario more than its values. A financial model that carries the 2026 figure forward assumes a market that the scenario does not expect to last.
Liquidity is the volume a market absorbs without the price moving against the battery’s own orders. The presentation tracks continuous intraday volumes in 15 markets: about 106 TWh in 2022, about 216 TWh in 2025 and 265 TWh projected for 2026, up 149% on 2022. Several smaller markets grew faster from a low base between 2022 and 2025: Danish DK1 from 3.1 to 16.7 TWh, Poland from 0.7 to 3.2 TWh, Finland from 1.4 to 4.0 TWh and Romania from 0.1 to 1.2 TWh. This growth in liquidity represents more numerous trading opportunities for BESS.
Volatility is the gap between low and high prices over a day, which is what a trading battery is paid for. Liquidity lets it execute the volume, and volatility decides whether the volume is worth executing. The presentation lists six drivers that are key when forecasting future revenue.
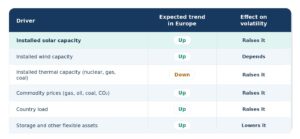
Source: Clean Horizon. Directions as shown on the presentation slide.
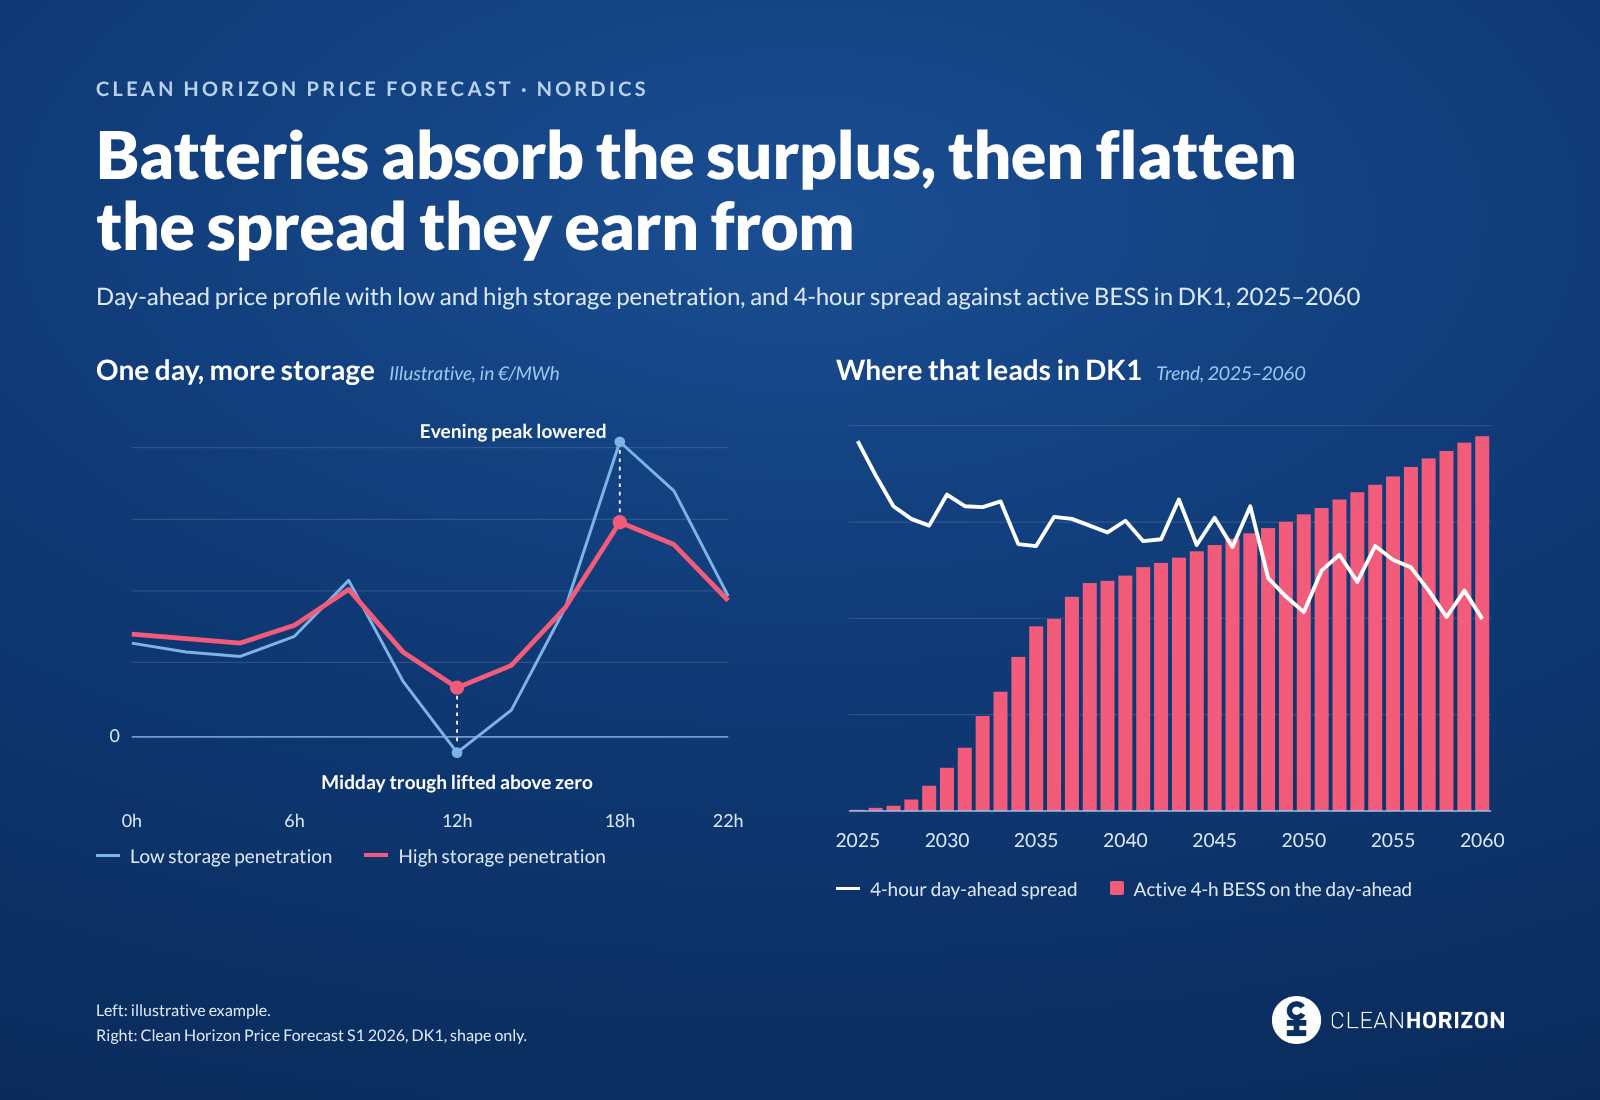
Solar widens spreads because its output peaks at midday, when prices are already low, without affecting peak prices. On two consecutive days in Germany, 15 and 16 September 2026, with similar load and commodity prices, the sunnier day had a day-ahead spread 68 €/MWh wider. Batteries work the other way: by charging at the lowest prices (increasing demand) and discharging at the highest (increasing supply), they reduce the spreads. An illustrative curve in the presentation shows a spread falling from 170 €/MWh to 70 €/MWh under high storage penetration. It does not reach zero: in Clean Horizon’s view it converges towards a floor set by round-trip losses and the cost of new storage. Wind has no single effect: very strong wind tends to narrow spreads, moderate wind to widen them. The Nordic case is in Can battery storage solve curtailment and negative prices in the Nordics?
Clean Horizon’s indicative profitability threshold is about 110 k€/MW/year of gross revenue for a 2-hour battery. A battery earning that sum every year for 15 years would return around 10%. The line is a yardstick between markets, not a project IRR, because grid fees differ from one country to another and move it.
The message of the presentation to project owners and lenders: returns of 30% are no longer realistic. Around 10% is the reference used here, but the return a project needs depends on the type of investor, and some can accept 5 to 6%. Most markets are above the line today, and a project can stay on the right side of it by modelling how revenues evolve over its 15 years instead of assuming they stay flat.
A lender can rely on a forecast it is able to take apart. A project that relies only on ancillary services is risky, as their upside is expected to disappear quickly because of their shallow depth. The project’s own numbers still decide: duration, co-location with a renewable plant and grid fees all move the result, and have to be set case by case.
Four checks help take a forecast apart:
Bottom line. Ancillary revenue declines first wherever batteries outnumber the volume the system buys. But a robust business model relies on multiple markets and their liquidity, as modelled in COSMOS. It can also be strengthened by subsidy schemes that are emerging more and more across Europe.
Estimating battery revenue market by market is what Clean Horizon does. The Storage Index tracks 18 countries every month and is free. The Price Forecast gives revenue stacks by market under several electricity mix scenarios, so Poland, Lithuania or Finland can be compared on the same basis. COSMOS runs a specific project through each market’s rules, from sizing to cash flows, NPV and IRR. It takes into account the ancillary service volumes and the number of operating batteries each year, to adjust the size of the bids placed on the markets so that the share captured by one asset stays realistic. Clean Horizon also acts as technical adviser to lenders. Its forecasts are scenarios with stated assumptions, and none of them is a promise of return.
Let’s talk if you are comparing countries for a battery project or preparing a financing file.